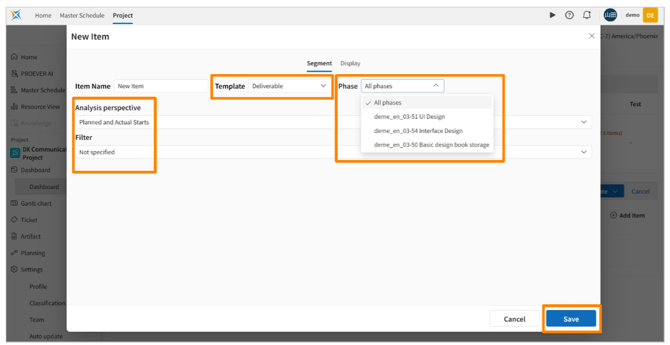
Dashboards allow you to filter and aggregate data by phase using the following two methods, depending on your needs:
1. Filtering the data in the Program / Project List by phase
Only Project Managers can edit this setting.
2. Filtering graphs and ticket lists by phase within dashboard templates
Further filtering by phase is available only when "Deliverables" or "Tasks" is selected as the Category.
- Note: This setting also applies to Project Reports, but it can only be edited on the Dashboard screen. It will also be applied to Project Templates.
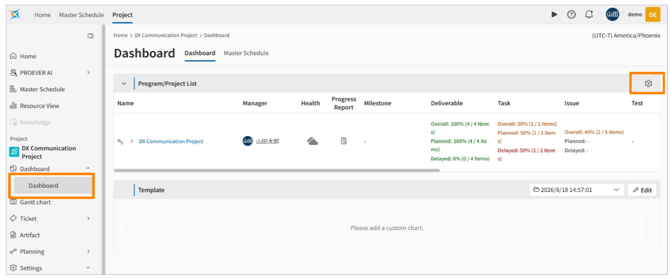
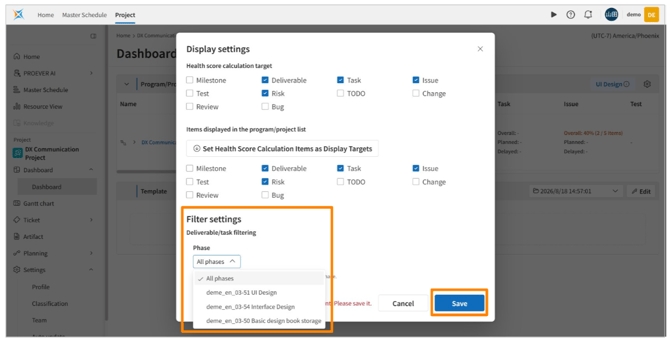
[Step] Filter the data in the Program/Project List by phase.
- Click "Dashboard"> "
 ".
". - Under Filter Settings, click the relevant phase from "Phase".
- Finally, click "Save".
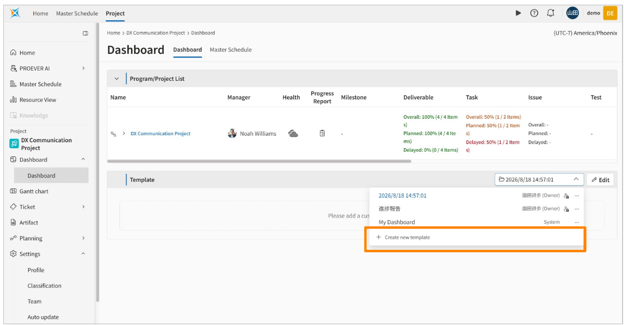
[Steps] Filtering graphs and ticket lists by phase within dashboard templates
- Navigate to "Dashboard" > "Create New Template" > "Add Item", and select the applicable chart.
- Note: Ticket counts per phase can only be aggregated using five specific items: Pie Chart, Line Chart, Bar Chart, Ticket List, and Category Analysis Chart.
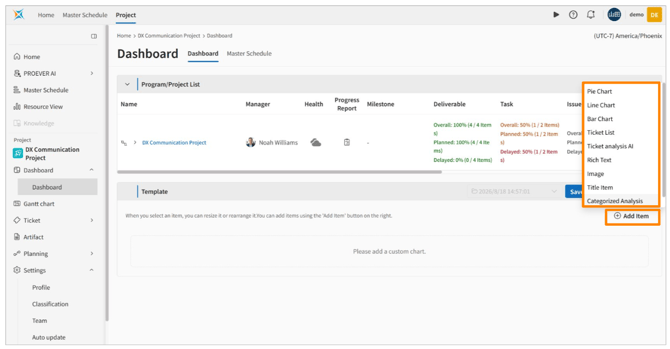
- Note: Ticket counts per phase can only be aggregated using five specific items: Pie Chart, Line Chart, Bar Chart, Ticket List, and Category Analysis Chart.
- Enter the item name.
- Under "Template", select the target for aggregation (Deliverable or Task).
- Select the phase.
- Click "Bulk Add" or "Add", and select at least one segment. (If you selected a chart other than the Category Analysis Chart)
- Finally, click "Save".
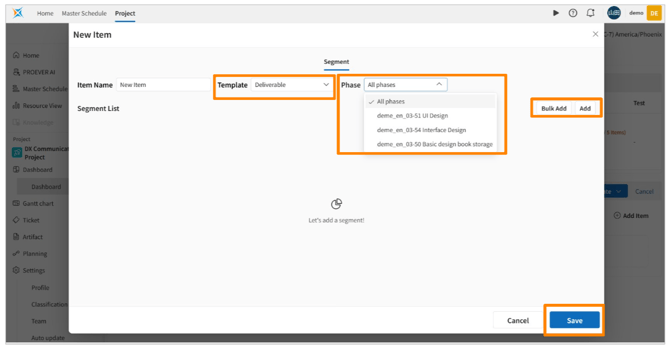
(Optional) Configure filters such as analysis perspective, assignee, or assigned team as needed. (If you selected the Category Analysis Chart)